Analyze labor costs by project with breakdowns of active employees, time worked at different rate tiers, and total expenses.
What Is This?
The Budget report gives managers a project-level financial view of labor costs. It shows how many employees were active on each project, how many hours were worked at different rate tiers (100% base, 200% overtime, 300% night/holiday), and the associated costs. The report uses a multi-level table structure with summary rows per project and a grand total at the bottom.
This report is essential for project budgeting, cost tracking, and comparing actual labor spend against planned budgets.
Prerequisites
| # | Prerequisite | Details |
|---|---|---|
| 1 | Pay rates configured | Employee or position pay rates must be set up for cost calculations. |
| 2 | Published schedules or attendance data | Time worked data comes from schedules or the Attendance module. |
| 3 | Manager, Admin, or Owner role | Full access requires elevated permissions. |
Step-by-Step Instructions
Accessing the Report
| Step | Action | Expected Result |
|---|---|---|
| 1 | Navigate to Reports from the left sidebar. | The Reports page opens. |
| 2 | Select Budget from the report list. | The report loads with filters and the multi-level data table. |
Applying Filters
| Filter | Type | Description |
|---|---|---|
| Projects | Multi-select | Filter by one or more projects. |
| Date range | Date picker | Select the period to analyze budget data. |
| Step | Action | Expected Result |
|---|---|---|
| 1 | Select the desired projects and date range. | Filters are configured. |
| 2 | Click Apply Filter. | The table updates with budget data for the selected criteria. |
Reading the Report Table
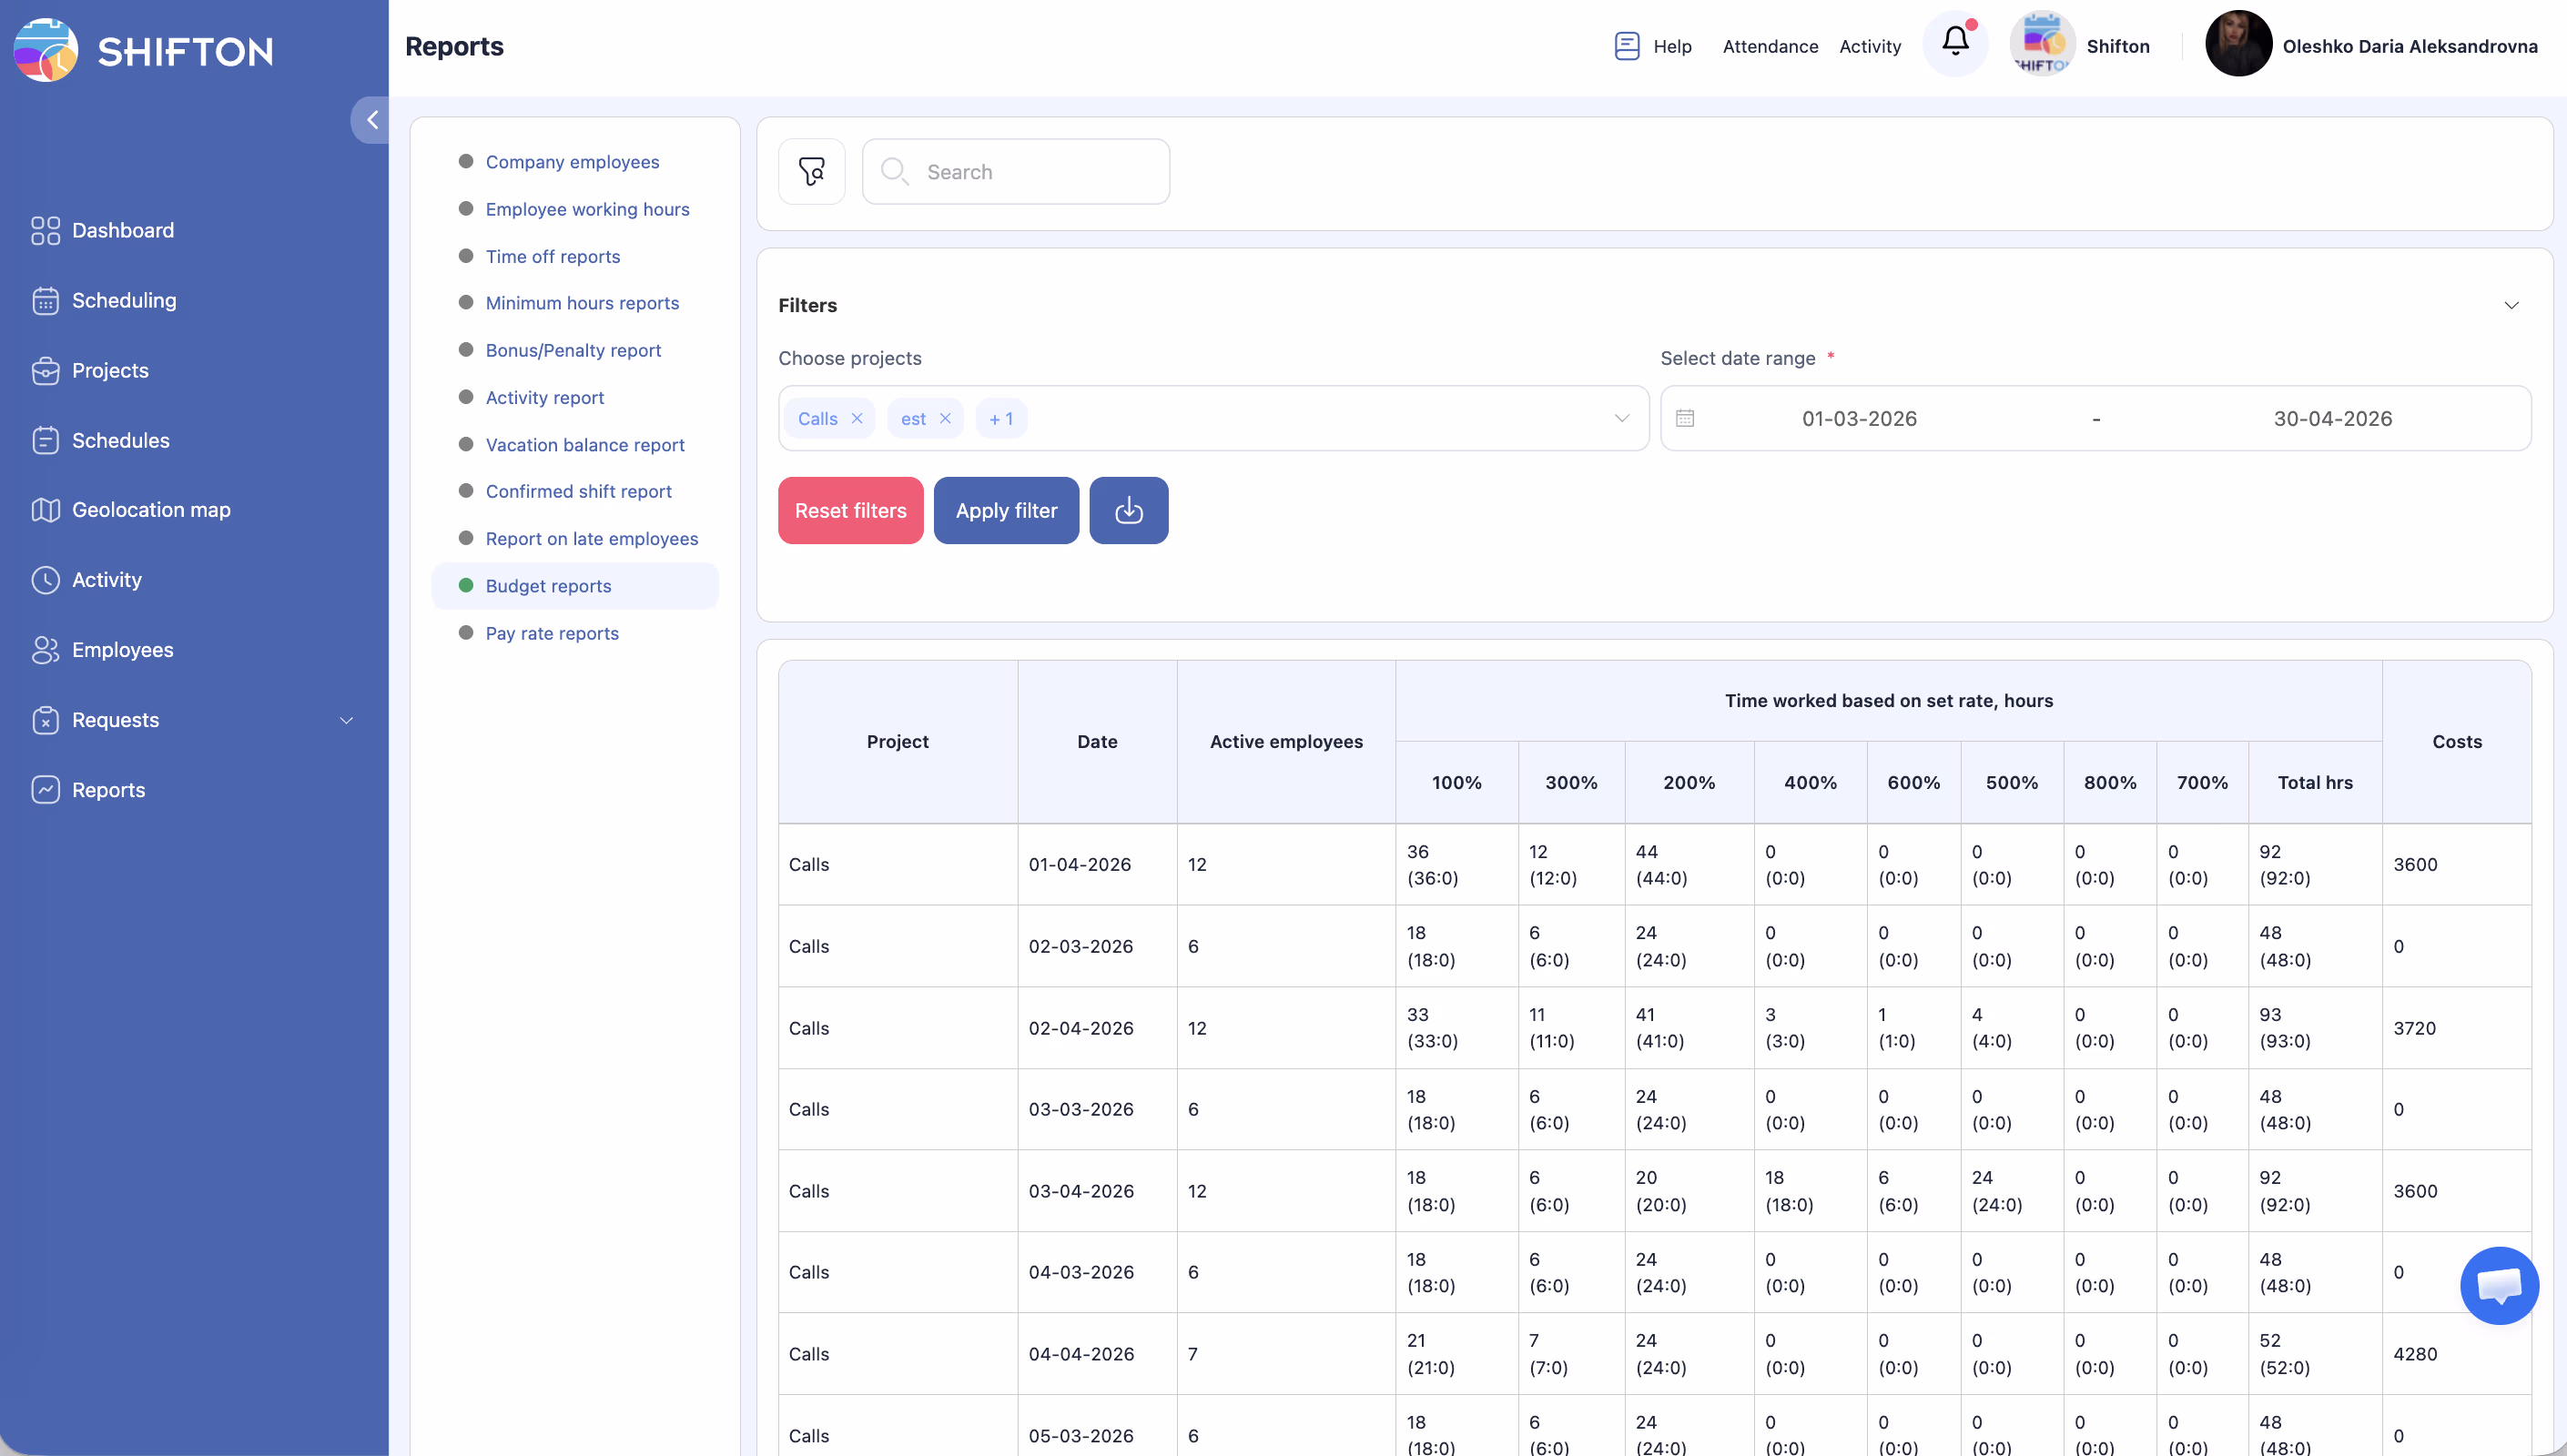
The Budget report uses a multi-level table structure:
| Level | Description |
|---|---|
| Project header row | Shows the project name. All rows below belong to this project until the next project header. |
| Date rows | Individual rows per date showing daily breakdown of employees, hours, and costs. |
| Project summary row | Aggregated totals for the project across all dates. |
| Grand total row | Overall totals across all projects at the bottom of the table. |
| Column | Description |
|---|---|
| Project | The project name (shown in header rows). |
| Date | The specific date for the row. |
| Active employees | Number of employees who worked on this project on this date. |
| Time worked — 100% | Hours worked at the base (100%) rate. |
| Time worked — 300% | Hours worked at the 300% rate (e.g., night or holiday shifts). |
| Time worked — 200% | Hours worked at the 200% rate (e.g., overtime). |
| Time worked — Total hrs | Total hours across all rate tiers. |
| Costs | Total labor cost for this row based on hours and applicable rates. |
Access Permissions
| Role | View Report | Export Report | See All Projects |
|---|---|---|---|
| Employee | No | No | No |
| Manager | All | Yes | Yes |
| Admin | All | Yes | Yes |
| Owner | All | Yes | Yes |
FAQ
Q1: What do the 100%, 200%, and 300% rate tiers mean?
These represent different pay rate multipliers. 100% is the base rate for regular hours. 200% typically applies to overtime hours. 300% typically applies to night shifts or holiday work. The exact definitions depend on your company’s pay rate configuration.
Q2: How are costs calculated?
Costs are calculated by multiplying the hours worked in each rate tier by the applicable pay rate for the employee or position. The total cost is the sum across all tiers.
Q3: Can I compare budget across multiple projects?
Yes. Select multiple projects in the filter, and the report shows each project separately with a grand total row at the bottom for comparison.
Q4: Does this report include bonuses and penalties?
No. The Budget report focuses on base labor costs from hours worked. For bonuses and penalties, use the Bonus/Penalty report. For a complete salary view, use the Pay Rate report.
Possible Issues and Solutions
| Issue | Possible Cause | Solution |
|---|---|---|
| Costs show 0 for all rows | Pay rates are not configured for employees or positions. | Set up pay rates in Settings > Pay Rates or in individual employee profiles. |
| A project is missing from the report | The project filter may be excluding it, or no shifts were worked for that project. | Reset filters to show all projects, or verify that shifts exist for the project in the selected period. |
| Rate tier hours do not add up to total | Rounding of partial hours. | Export the data for precise calculation. Small differences are typically due to display rounding. |
| Grand total seems too high or low | The date range may include more or fewer days than expected. | Double-check the date range filter values. |
| Some dates show 0 active employees | No shifts were scheduled or worked on those dates for the project. | This is expected for days off or non-working days. |