Get a comprehensive salary breakdown per employee, including base pay, overtime, night rates, bonuses, penalties, and final salary calculations.
What Is This?
The Pay Rate report is the most detailed financial report in Shifton. It combines hours worked at different rate tiers, the corresponding costs, and all financial adjustments (bonuses, penalties, advances) into a single view per employee. The result is a complete salary calculation that can be used directly for payroll processing.
The report uses a multi-level table structure where each employee’s data is broken down by project, schedule, and rate tier, with a final salary figure that accounts for all additions and deductions.
Prerequisites
| # | Prerequisite | Details |
|---|---|---|
| 1 | Pay rates configured | Base, overtime, and night rates must be set up for employees or positions. |
| 2 | Attendance or schedule data | Hours worked must be recorded through schedules or the Attendance module. |
| 3 | Financial adjustments recorded (optional) | Bonuses, penalties, and advances should be entered if you want a complete salary view. |
| 4 | Manager, Admin, or Owner role | Full access requires elevated permissions. |
Step-by-Step Instructions
Accessing the Report
| Step | Action | Expected Result |
|---|---|---|
| 1 | Navigate to Reports from the left sidebar. | The Reports page opens. |
| 2 | Select Pay Rate from the report list. | The report loads with filters and the multi-level data table. |
Applying Filters
| Filter | Type | Description |
|---|---|---|
| Projects | Multi-select | Filter by one or more projects. |
| Date range | Date picker | Select the pay period to calculate. |
| Marks | Multi-select | Filter by custom marks/tags. |
| Position | Dropdown | Filter by employee position. |
| Step | Action | Expected Result |
|---|---|---|
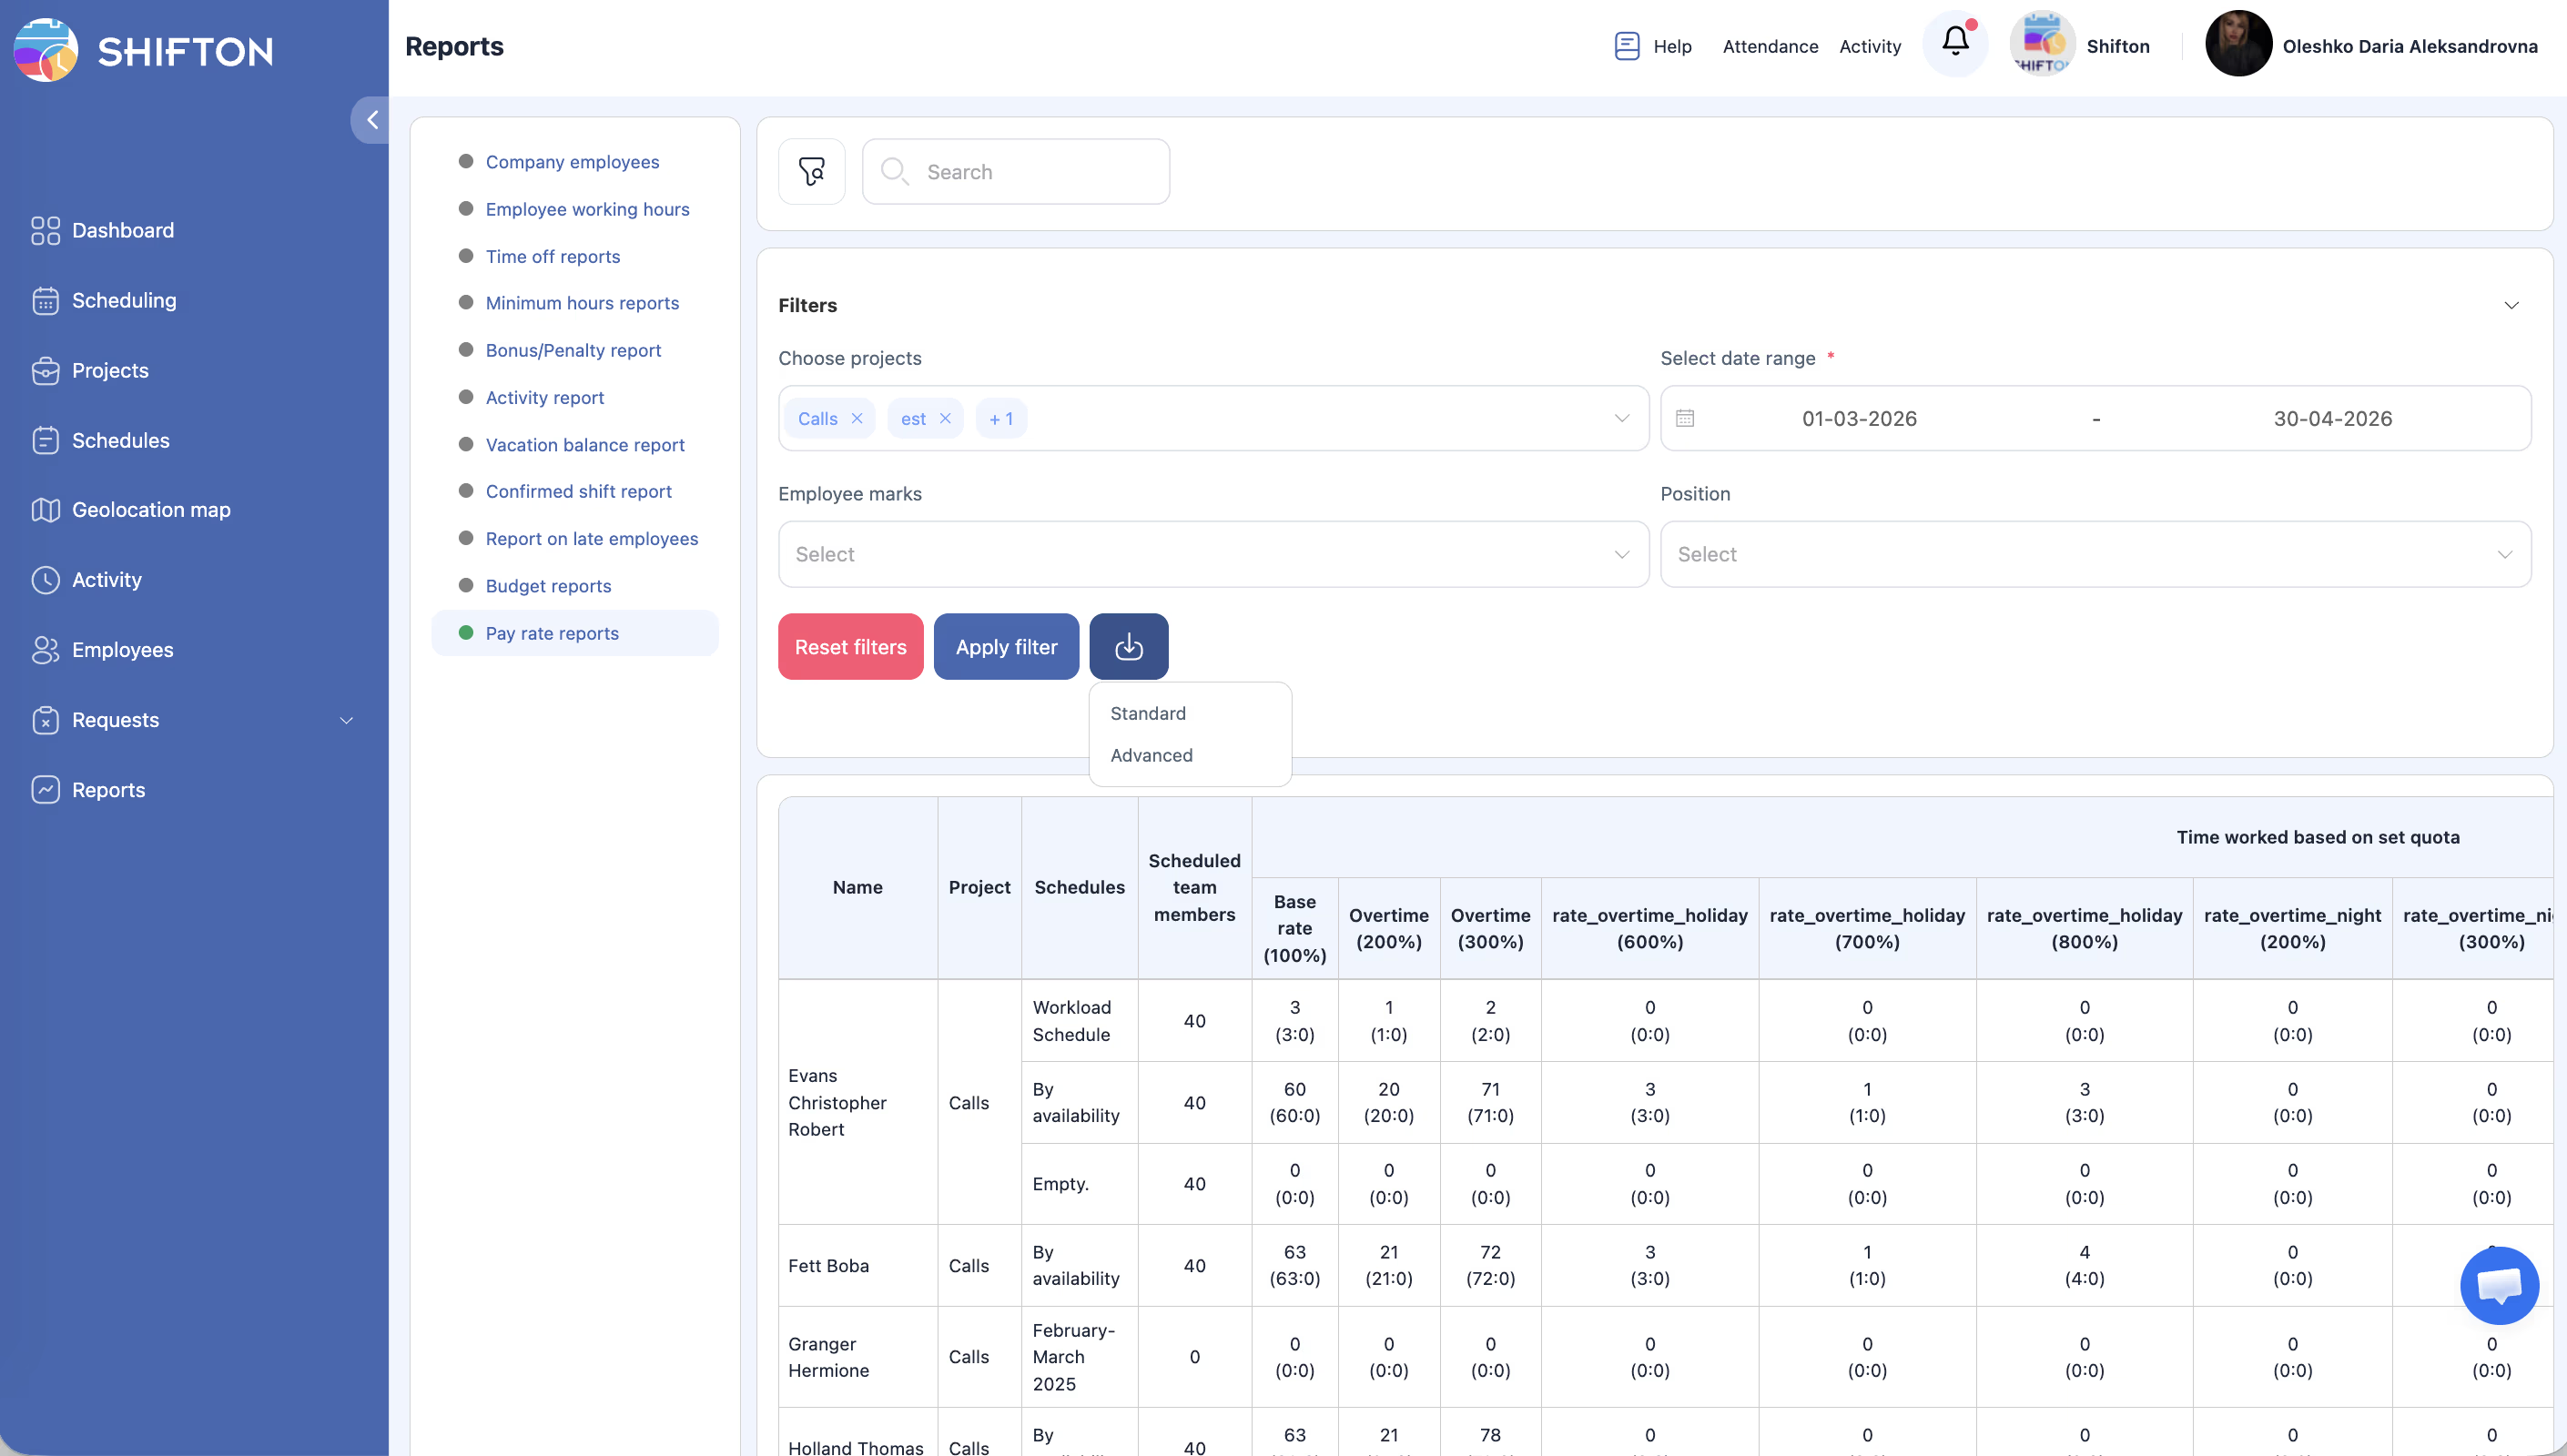
| 1 | Set the date range (typically aligned with your pay period) and any additional filters. | Filters are configured. |
| 2 | Click Apply Filter. | The table updates with detailed salary data. |
Reading the Report Table
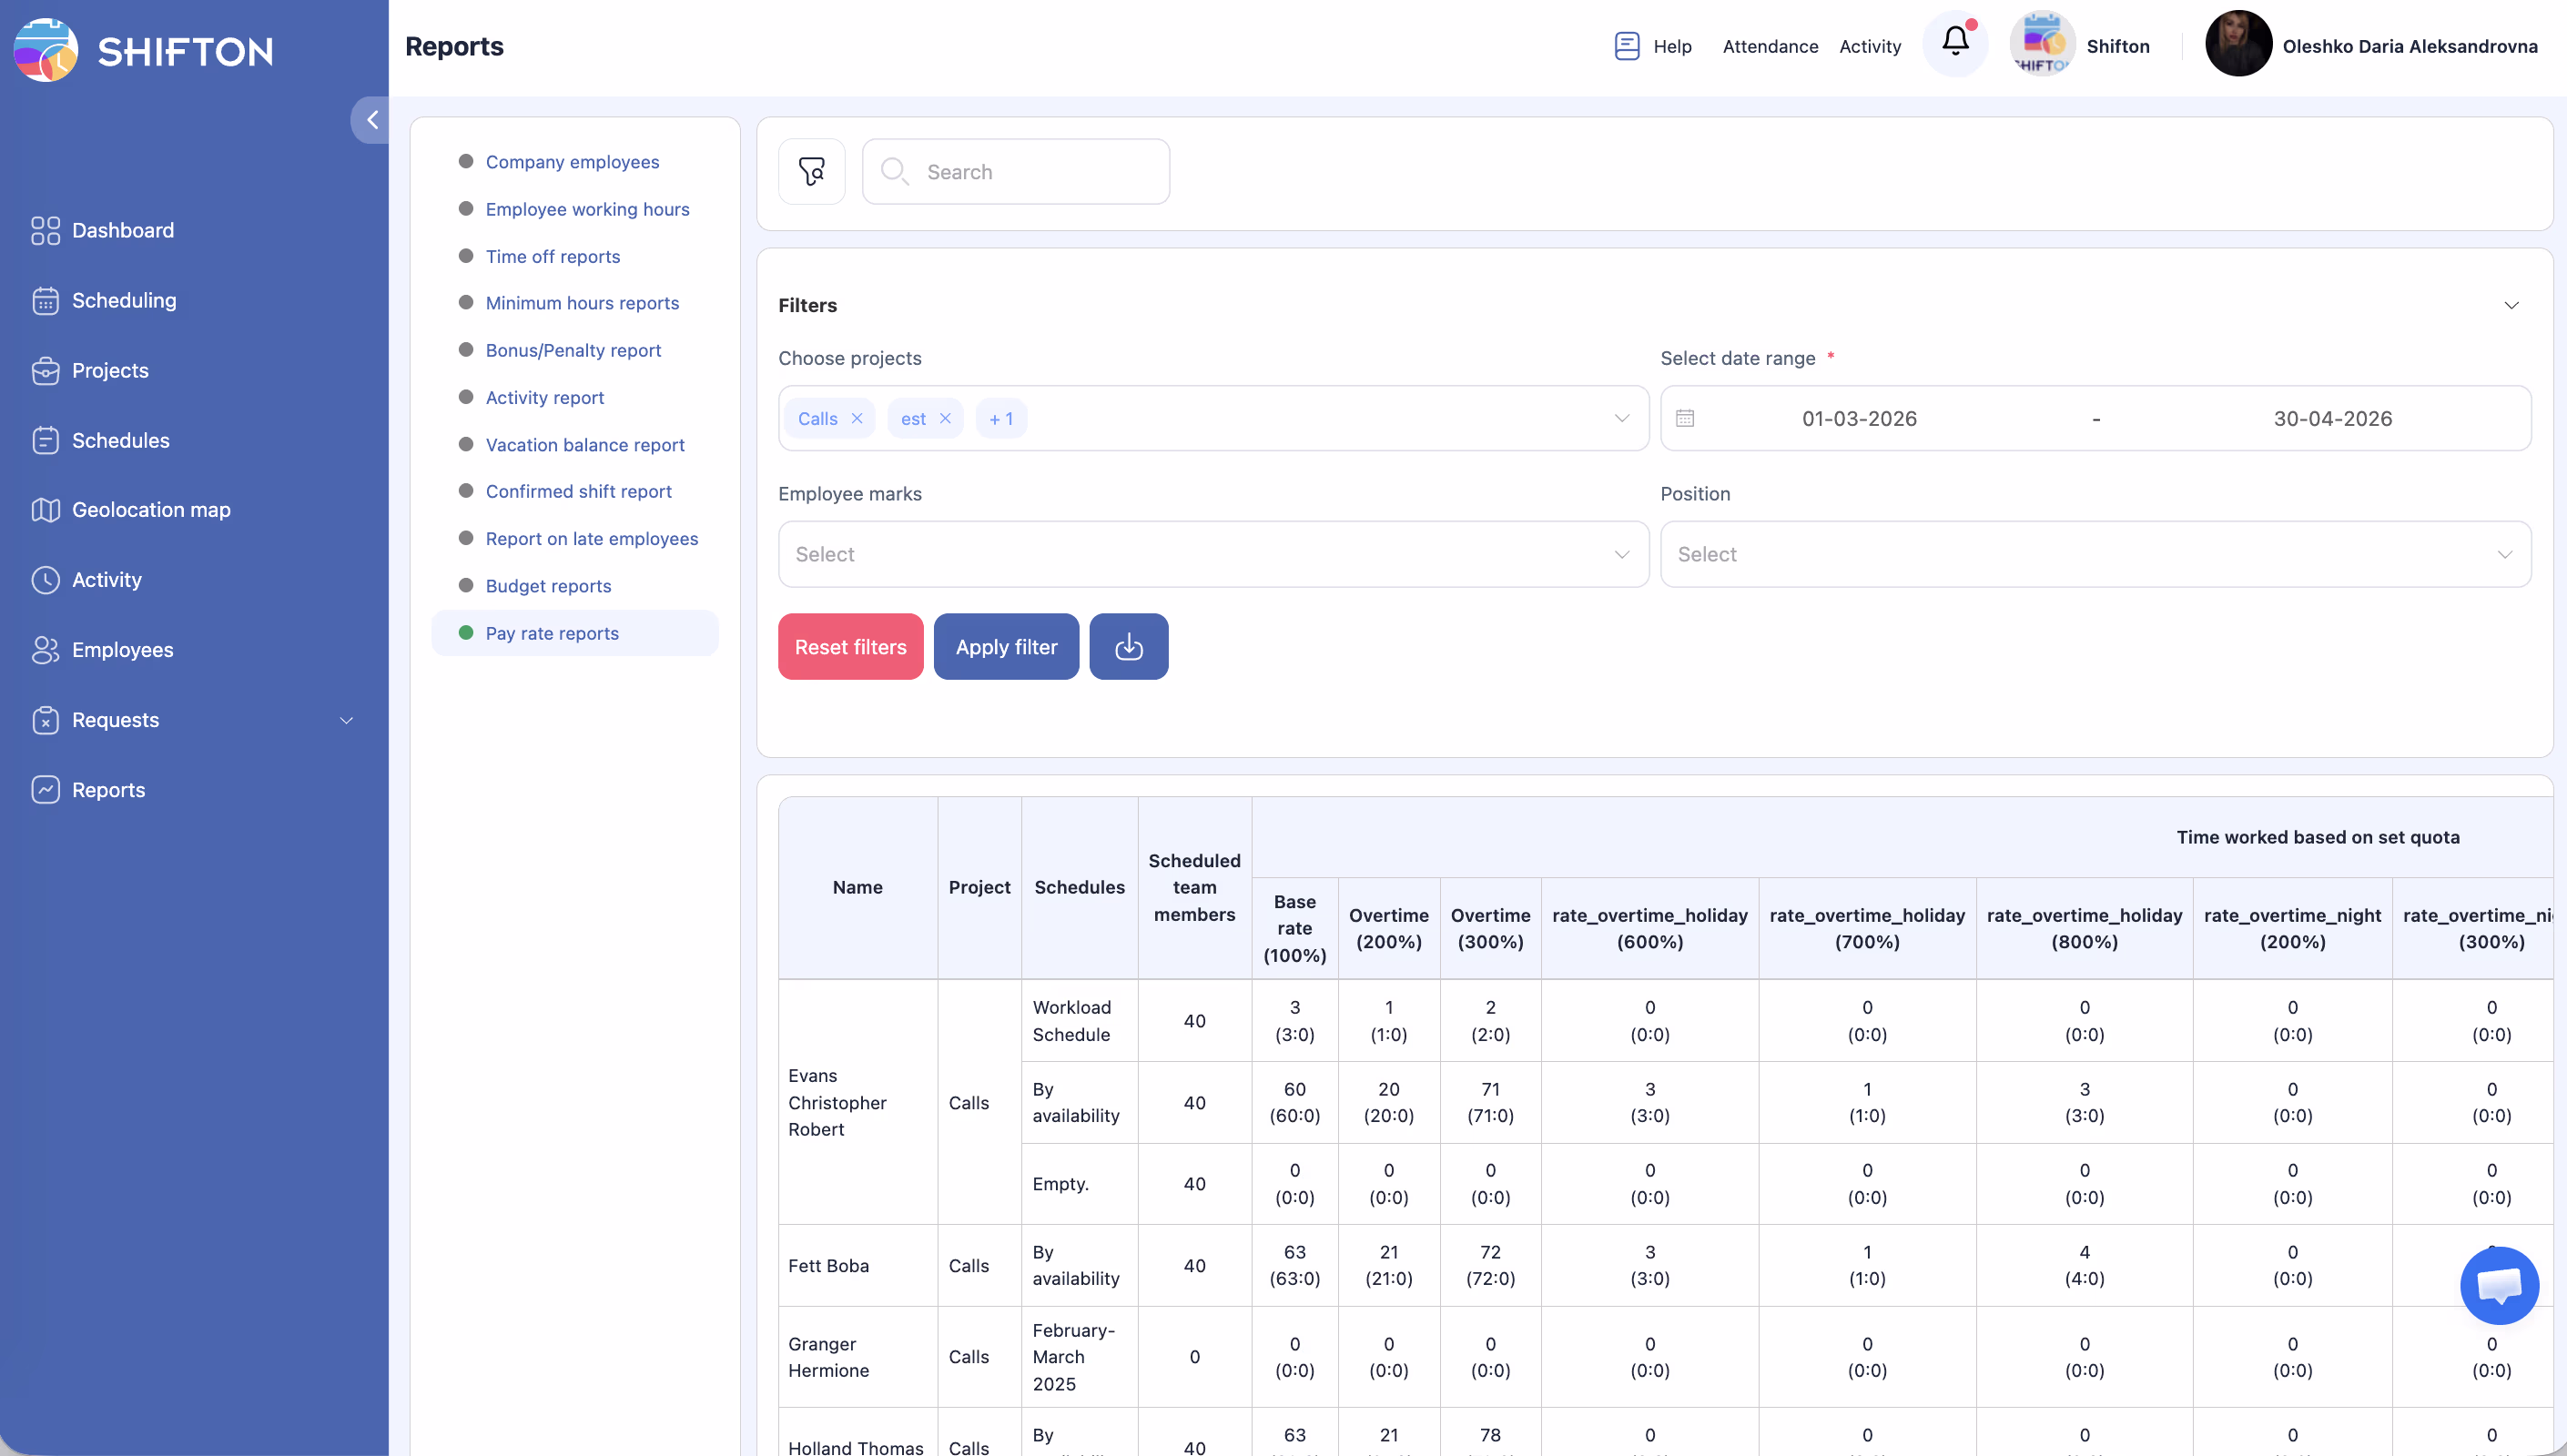
The Pay Rate report uses a multi-level table with the following structure:
| Level | Description |
|---|---|
| Employee header | Shows the employee name and position. |
| Project rows | Each project the employee worked on during the period. |
| Schedule rows | Each schedule within the project. |
| Team member rows | If multiple team members share a schedule, individual entries appear. |
| Employee summary | Aggregated totals and final salary for the employee. |
Column Reference
| Column Group | Column | Description |
|---|---|---|
| Identification | Name | Employee name. |
| Project | The project name. | |
| Schedules | The schedule name within the project. | |
| Scheduled members | Number of team members assigned to the schedule. | |
| Time Worked | Time worked (Base 100%) | Hours worked at the base rate. |
| Time worked (OT 200%) | Hours worked at the first overtime tier (200% rate). | |
| Time worked (OT 300%) | Hours worked at the second overtime tier (300% rate). | |
| Costs | Costs (Base) | Cost of base-rate hours. |
| Costs (OT 200%) | Cost of first overtime tier hours. | |
| Costs (OT 300%) | Cost of second overtime tier hours. | |
| Salary Calculation | Total schedule salary | Sum of all cost columns for the schedule. |
| Bonus | Total bonuses for the employee. | |
| Penalty | Total penalties (retentions) for the employee. | |
| Advance | Total advance payments. | |
| Total salary | schedule salary + bonus – penalty + advance. | |
| Final salary minus advance | Net salary after deducting advance. | |
| Metadata | Number of shifts | Total shifts worked in the period. |
Understanding the Overtime Tier Logic
Overtime tiers are calculated per day, not per week. The tiers are set in Salary Settings and define at which daily hour thresholds higher rates begin.
Example (verified against the Shifton pay rate report):
– Base rate: $40/hour
– Daily quota: 5h, Overtime tiers: After 3h → 200%, After 4h → 300%
– 5 shifts × 8h = 40h total; per day breakdown:
– Hours 0–3: base rate → 3h/day × 5 days = 15h base
– Hours 3–4: 200% rate → 1h/day × 5 days = 5h at 200%
– Hours 4–8: 300% rate → 4h/day × 5 days = 20h at 300%
– Costs: 15h × $40 = $600 + 5h × $80 = $400 + 20h × $120 = $2,400
– Total: $3,400
Understanding the Salary Calculation Formula
| Step | Calculation |
|---|---|
| 1 | Base cost = Base hours × Base rate |
| 2 | OT 200% cost = OT hours × Base rate × 2 |
| 3 | OT 300% cost = OT hours × Base rate × 3 |
| 4 | Total schedule salary = Base cost + OT 200% cost + OT 300% cost |
| 5 | Total salary = Total schedule salary + Bonus − Penalty + Advance |
| 6 | Final salary minus advance = Total salary − Advance |
Access Permissions
| Role | View Report | Export Report | See All Employees |
|---|---|---|---|
| Employee | Own data only | No | No |
| Manager | All | Yes | Yes |
| Admin | All | Yes | Yes |
| Owner | All | Yes | Yes |
FAQ
Q1: Can I use this report directly for payroll?
Yes. The Pay Rate report is designed to provide all the data needed for payroll processing. Export it and use it as a reference or import it into your payroll system.
Q2: What if an employee works on multiple projects?
Each project appears as a separate row under the employee’s header. All projects are summed in the employee’s total salary.
Q3: How are overtime tiers determined?
Overtime tiers are configured in Salary Settings (Company Settings → Salary Settings). Tiers are calculated per day: when daily hours exceed the tier threshold, those hours are rated at the higher percentage. For example, with tiers “After 3h → 200%, After 4h → 300%”, the first 3 hours of any shift are base rate, hours 3–4 are at 200%, and hours beyond 4 are at 300%.
Q4: Does the “Final salary minus” account for taxes?
No. Shifton calculates gross salary with internal adjustments (bonuses, penalties, advances). Tax deductions are handled by your payroll or accounting system.
Q5: What does “Number of shifts” tell me?
It shows the total count of individual shifts the employee worked during the pay period. This can be useful for per-shift bonus calculations or audit purposes.
Possible Issues and Solutions
| Issue | Possible Cause | Solution |
|---|---|---|
| All cost columns show 0 | Pay rates are not configured. | Set up pay rates in Settings > Pay Rates or in employee/position profiles. |
| Overtime or night hours are not classified correctly | Shift schedule does not have rate tiers configured properly. | Review the schedule settings and ensure overtime and night windows are defined. |
| Bonus and penalty columns are empty | No financial adjustments have been recorded for the period. | Enter bonuses or penalties through the employee management interface if applicable. |
| Employee is missing from the report | No shifts were worked by the employee in the selected period. | Broaden the date range or verify the employee’s schedule. |
| Final salary does not match manual calculations | Differences in how partial hours or rounding are handled. | Export the data and verify each column step by step against the salary calculation formula. |