

The regular Reports section provides ready-made forms. Dynamic reports is a builder: you set the period, the filters and the grouping yourself, get exactly the slice of task data you need and save it so that you do not have to assemble it again.
The page opens from the left menu: Reports (new).
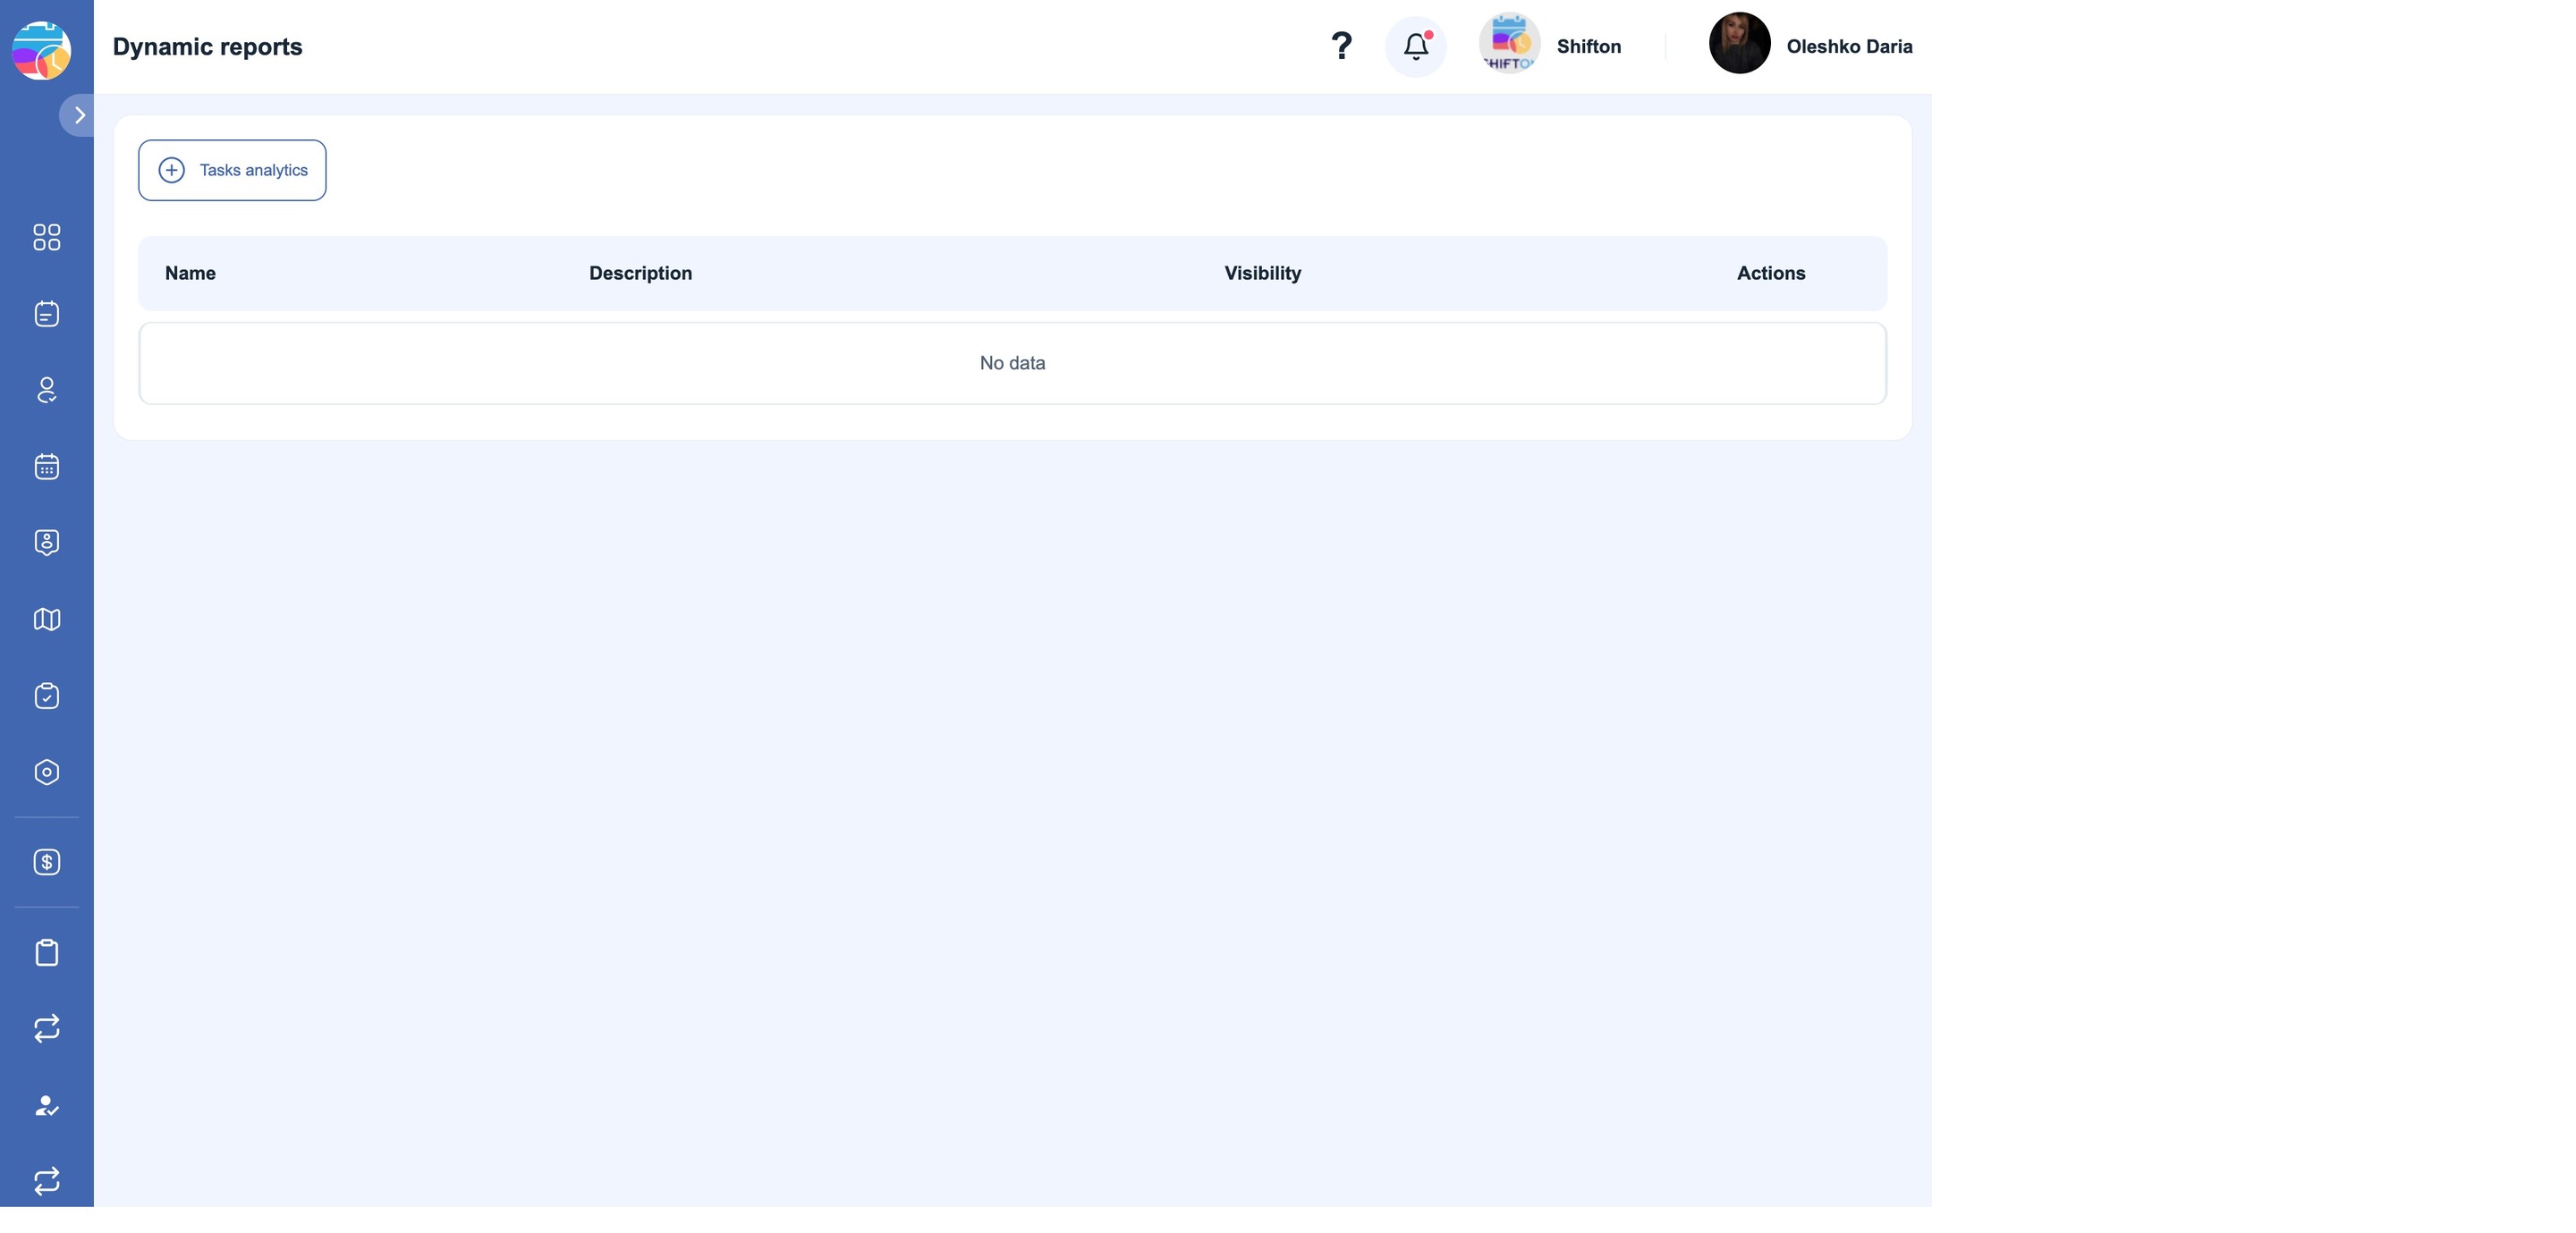
Tasks analytics
In field service mode there is a single builder on the page — Tasks analytics. It counts everything to do with tasks: how many were created and completed, how many were cancelled and overdue, how much time completion takes.
*(In scheduling mode this same page has other builders — for shifts and activities. The set depends on the company’s work mode.)*
How to build a report
- Date range — the calculation period. A mandatory condition.
- Add filter — additional conditions to narrow down the selection.
- Apply — recalculate. The table will not be updated until you click it.
- Period grouping — which intervals to split the rows by: month, week, day.
- Group by — the second level of splitting, for example by completion status.
- Search — find a row in the finished table.
- Decimal hours — the
1.5time format instead of1:30.
Ready-made periods
The Date range field does not have to be filled in manually: clicking it opens a calendar with a list of ready-made options — Today, Yesterday, Tomorrow, This week, Last week, Next week, Last 7 days, Last 30 days, This month, Last month, Next month and others. This is usually enough; the period is set manually when a non-standard interval is needed.
A subtotal is shown at the end of every group, and the overall total below.
What it looks like with real data
Below is a report on tasks for 2026 grouped by month and by completion status. You can see how many tasks were completed in each month, how many are active and how many are waiting in the queue:
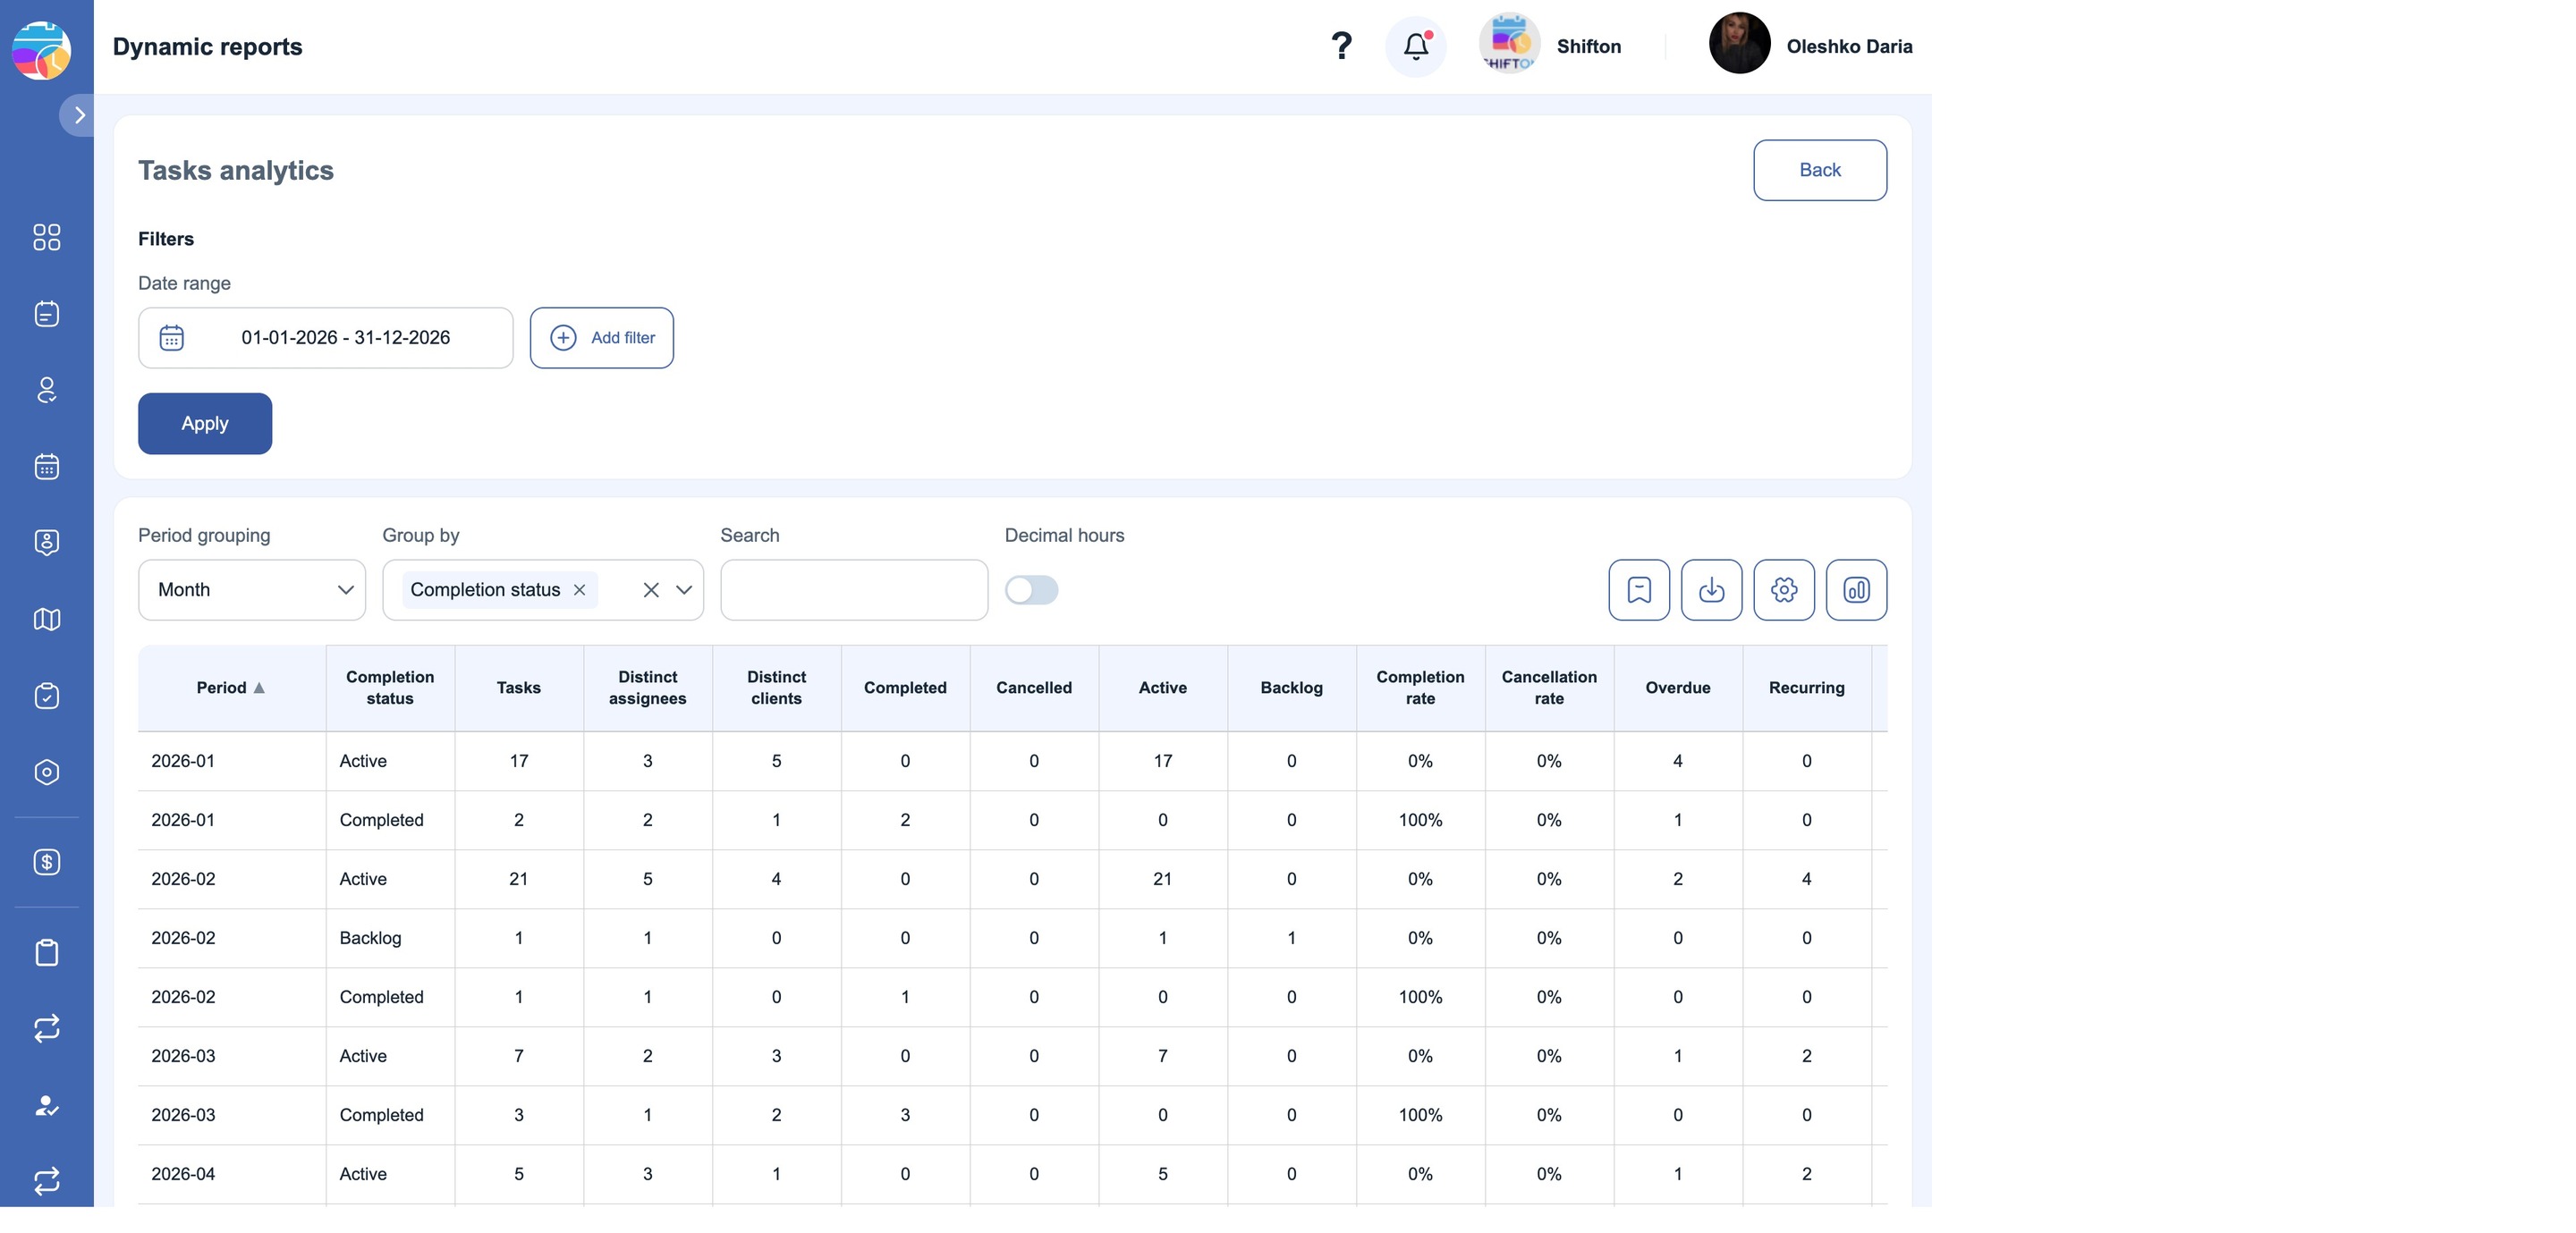
It reads like this: the row “2026-02 / Active — 21 tasks, 5 technicians, 4 clients” means that 21 tasks were still in progress in February. The row next to it, “2026-02 / Backlog — 1”, means that one task was never picked up.
What can be counted
Thirty task metrics are available:
- Count: total tasks, unique technicians, unique clients.
- By state: completed, cancelled, in progress, in the queue (Backlog), completion rate and cancellation rate.
- Problematic: overdue tasks.
- Task properties: recurring, with a checklist, with notes, subtasks.
- Lead time: total, minimum, maximum and average.
- Delays: total and average.
- Full cycle: the total and average lifetime of a task — from creation to closing.
- Time spent: the total and average time logged by the technicians.
- Planned items: the number of items, how many of them were completed, their cost and the completion rate.
Unnecessary columns are removed with the settings button — the gear icon above the table opens the Manage columns panel. Please note: the list of columns appears there only after the report has been built — there is nothing to configure in an empty report.
How this helps in practice. The completion rate and the cancellation rate by month show whether the service works consistently. Overdue tasks and the average delay show where planning breaks down. The difference between completion time and full cycle time shows how long a task waited before someone picked it up.
Chart
The chart button above the table opens a graph based on the same data — this is not just “another view” but a separate panel with settings:
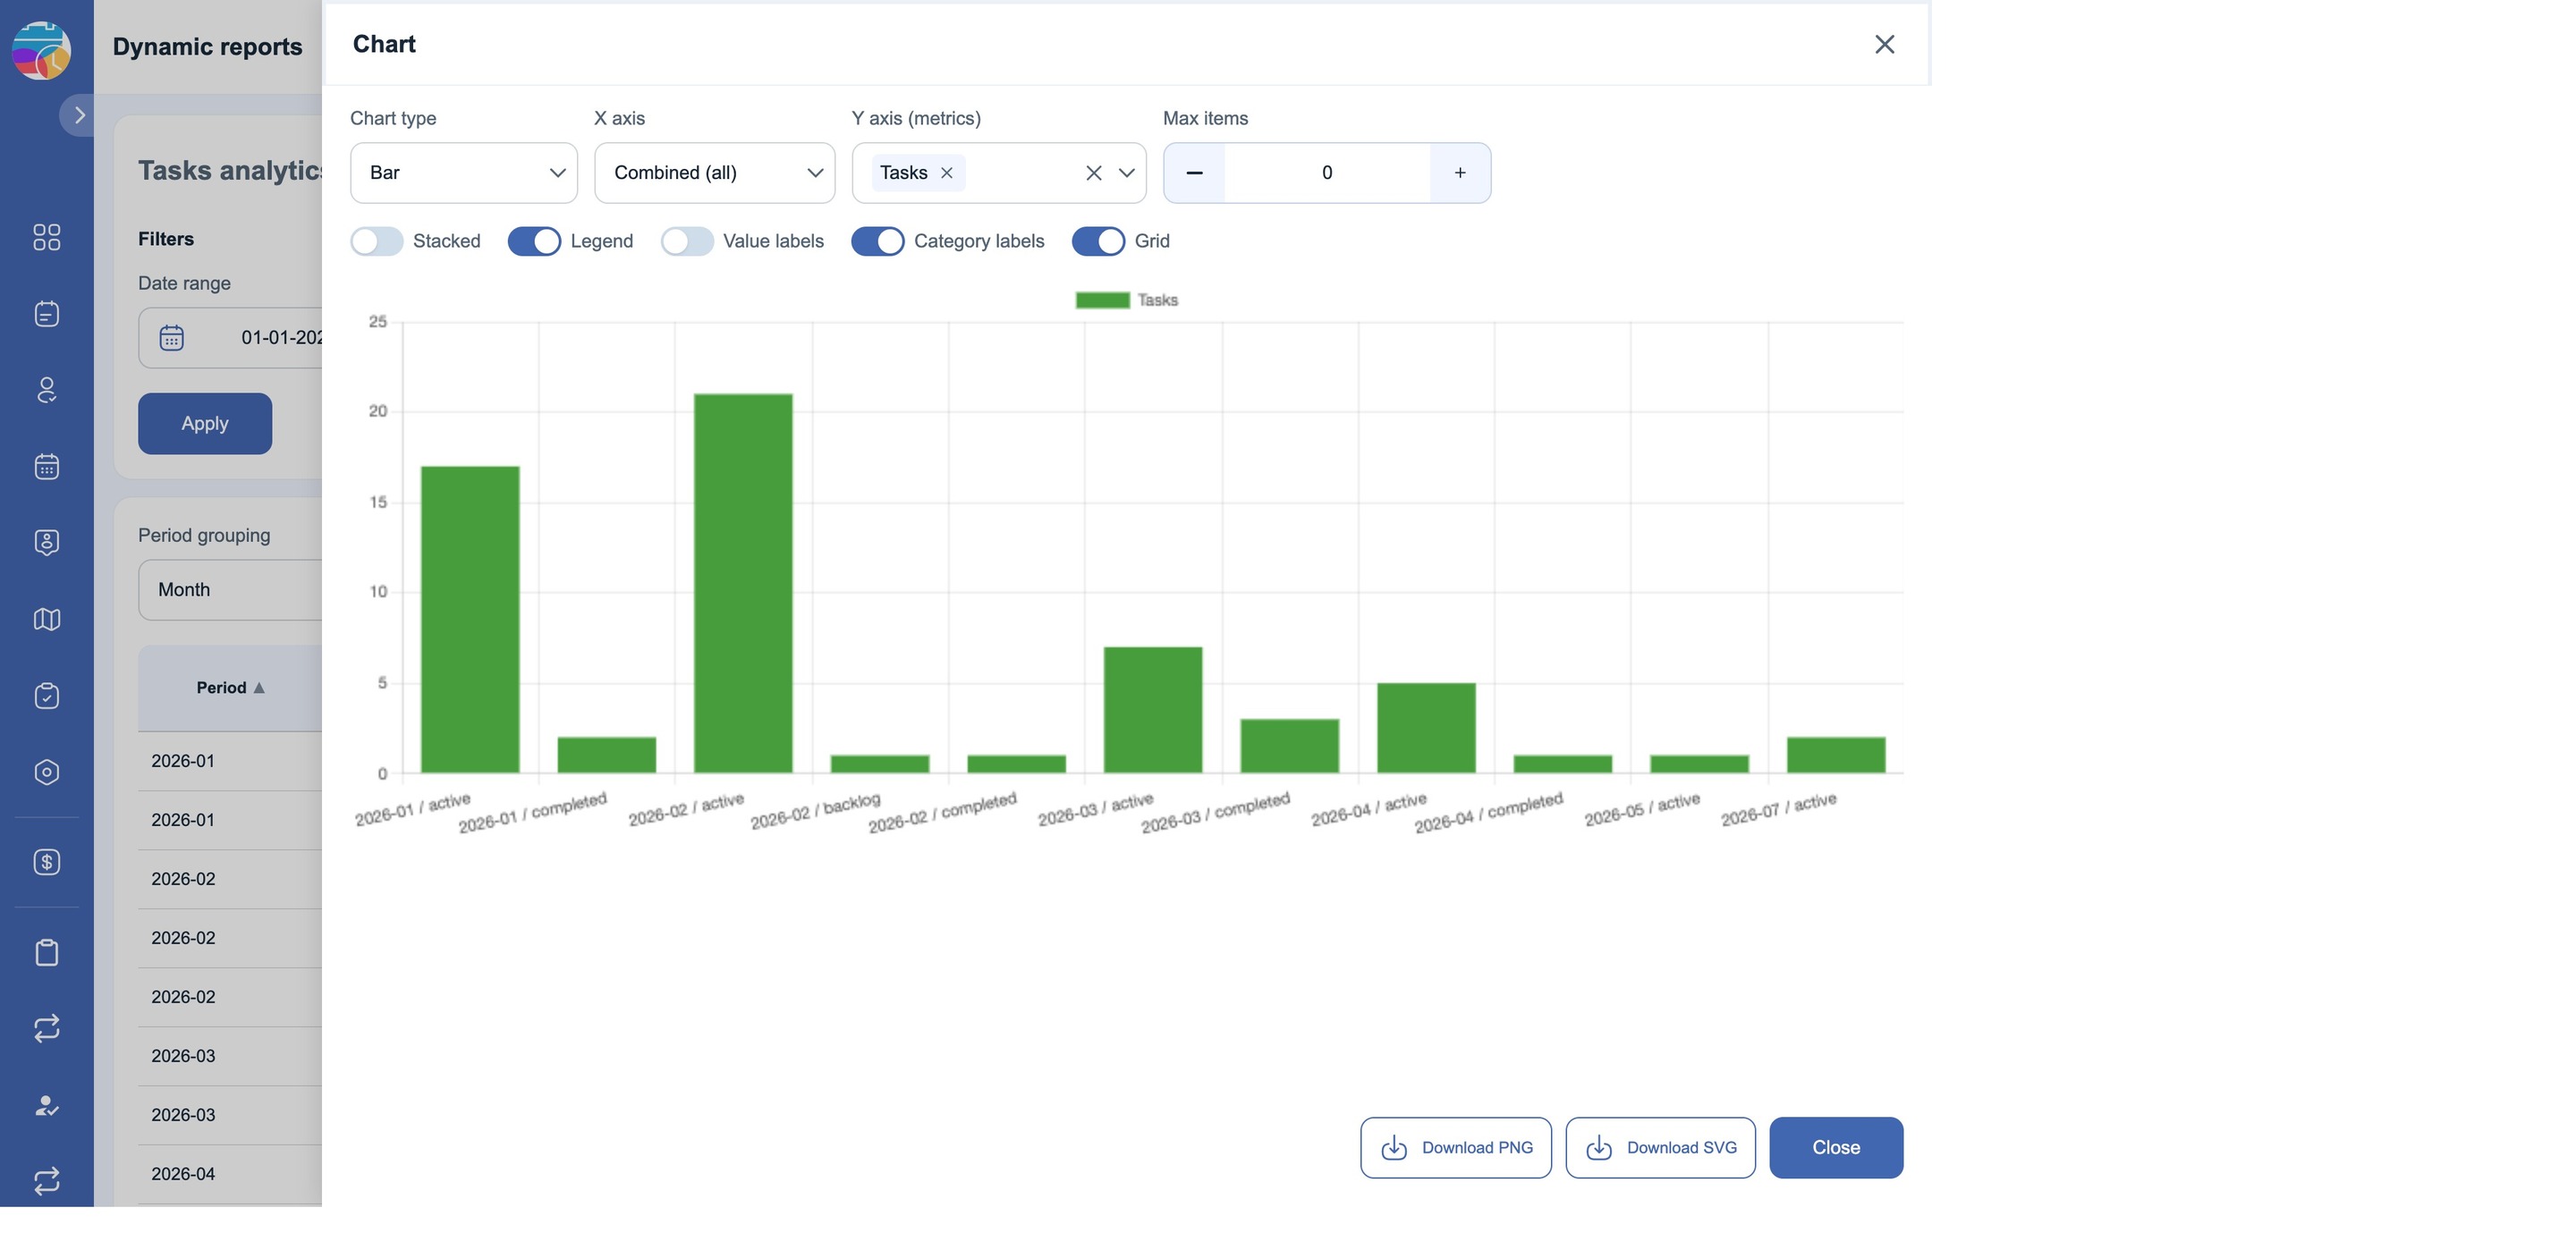
- Chart type — the type of chart, for example a bar chart.
- X axis — what to plot horizontally. The Combined (all) option merges the groupings into a single label, for example “2026-02 / active”.
- Y axis (metrics) — which metrics to plot. You can select several at once.
- Max items — a limit on the number of elements so that the graph does not turn into a picket fence.
0means no limit. - Toggles: Stacked (stack the bars on top of each other), Legend (the legend), Value labels (value labels), Category labels (category labels), Grid (the grid).
The finished graph is downloaded with the Download PNG and Download SVG buttons — the second format does not lose quality when scaled, which makes it convenient for presentations.
Saving and exporting
There are four buttons above the table: save, export to a file, column settings and switching to the chart.
Three things are specified when saving:
- Title — the name in the list of reports.
- Description — a description: what to look at in the report.
- Who can see the report — “Only me” or “Everyone in this company”.
A saved report appears in the list on the main page of the section with the Title, Description and Visibility columns and a set of actions. A private report is marked as personal. There are two actions in the row: open (the eye) and delete (the bin) — deleting asks for confirmation.
Permissions
| Role | What they can do |
|---|---|
| Employee | Has no access to reports |
| Administrator | Build, view, save and export |
| Owner | Full access |
Possible problems and solutions
| Problem | Reason | Solution |
|---|---|---|
| There is no Reports (new) item in the menu | Insufficient permissions | The administrator or owner role is required |
| The table is empty after Apply | There are no tasks for the period, or the filters are too narrow | Widen the date range, remove the filters and click Apply again |
| I changed a filter, but the numbers are the same | The report has not been recalculated | Click Apply — there is no automatic recalculation |
| Instead of Tasks analytics there are builders for shifts | The company works in scheduling mode | Switch the work mode or use the shift analytics |
| A colleague cannot see a saved report | It is saved as private (personal) | Save it again with the “Everyone in this company” visibility |
| The planned item metrics are empty | Planned items were not used in the tasks | These columns are filled in only for tasks with items |
FAQ
Question: How do dynamic reports differ from the regular ones? Answer: The regular ones are ready-made forms with a fixed set of data. Here you set the period, the filters, the grouping and the set of metrics yourself, and you save the result for reuse.
Question: Is it mandatory to set a period? Answer: Yes, a report cannot be built without a date range.
Question: Why don’t the figures change after I change a filter? Answer: You need to click Apply.
Question: How many task metrics are available? Answer: Thirty — from the number of tasks and the completion rate to the full cycle time and the planned items.
Question: What is Backlog? Answer: Tasks that have not been picked up yet.
Question: How does the lead time differ from the full cycle time? Answer: The lead time is how long the work itself took. The full cycle is how much time passed from the creation of the task to its closing, including the waiting.
Question: Can the data be viewed as a graph? Answer: Yes, the chart button above the table.
Question: How do I export a report? Answer: With the export button above the table — the data is downloaded as a file.
Question: How do I share a report with colleagues? Answer: Choose the “Everyone in this company” visibility when saving.
Question: Does deleting a report delete the tasks? Answer: No, only the saved report configuration is deleted. The task data remains.
Question: Can a report be built for a single technician or client? Answer: Yes, through Add filter — and then group the result the way you need.